Home
NJ07
NJ07 Details
Leonard Lance (R) has held this U.S. congressional seat since 2008, he won in 2016 against Peter Jacob (54% - 43%)
In the Primary Election of June 5th, 2018, the Democract candidates combined received almost 6,000 votes more than the Republican combined.
NJ 07 District has elected a Republican Representative since 1914 with the only exception of A. Maguire between 1975 and 1981
NJ 07 District has a total population of about 732K people and an estimated voting age population of 568K people (as of 2017)
51.3% with bachelor degree or higher; 71% White, 13% Hispanic, 9% Asian, 5% African American, 19% of foreign born; Median household income of $106,896
2016 Presidential Results
Clinton: 181K (49%) - Trump: 176K (48%) [Hillary won by 4K votes)
2016 House Results
Jacob (D): 148K (43%) - Lance (R): 186K (54%) - Other: 10K (3%)
Lance won by 38K votes, 32K people voted for Hillary but not for Peter Jacob
In 2014 (last midterm election) Lance obtained 104K votes
More data
Counties and Municipalities in New Jersey’s 7th Congressional District
For the 113th and successive Congresses (based on redistricting following the 2010 United States Census), the congressional district contains portions of six counties and 74 municipalities.
Essex County
- Millburn (which includes the Short Hills neighborhood)
Hunterdon County
Alexandria Township,
Bethelehem Township,
Bloomsbury Borough,
Califon Borough,
Clinton Town,
Clinton Township,
Delaware Township,
East Amwell Township,
Flemington Borough,
Franklin Township,
Frenchtown Borough,
Glen Gardner Borough,
Hampton Borough,
High Bridge Borough,
Holland Township,
Kingwood Township,
Lambertville City,
Lebanon Borough,
Lebanon Township,
Milford Borough,
Raritan Township,
Readington Township,
Stockton Borough,
Tewksbury Township,
Union Township and
West Amwell Township
Morris County
- Chester Borough, Chester Township, Dover, Long Hill Township, Mine Hill Township, Mount Arlington, Mount Olive Township, Netcong, Roxbury Township, Washington Township and Wharton
Somerset County
-
Bedminster Township,
Bernards Township,
Bernardsville,
Branchburg Township,
Bridgewater Township,
Far Hills,
Green Brook Township,
Hillsborough Township,
Millstone,
Montgomery Township,
North Plainfield,
Peapack-Gladstone,
Raritan,
Rocky Hill,
Somerville,
Warren Township and
Watchung
Union County
-
Berkeley Heights,
Clark,
Cranford,
Garwood,
Kenilworth,
Mountainside,
New Providence,
Scotch Plains,
Springfield,
Summit,
Union,
Westfield and
Winfield
Warren County
- Alpha, Franklin Township, Greenwich Township, Harmony Township, Lopatcong Township, Phillipsburg and Pohatcong Township
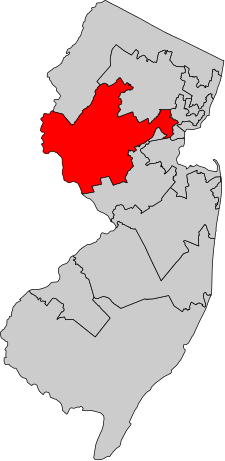 You can expand and move the map below to understand better the NJ CD7 district boundaries.
To find out if you are already registered to vote, or to check on the status of a new registration visit
Registration
To find out your polling location please visit Polling Locator
Additional Information and Statistics about New Jersey’s 7th Congressional District
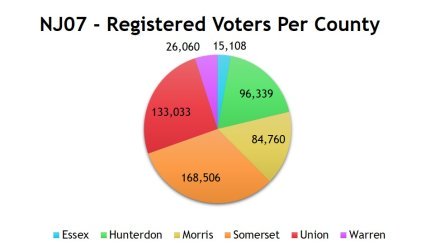

Charts above based on 2017 data
Wikipedia
Census with many demographic and socio-economic details
The turnout for the 2018 midterm primaries was the highest in years, with Democrats showing up at the polls in greater numbers that
Republicans in most congressional districts
To switch between maps showing which party had a greater turnout and the total turnout by county, click the Visible layers box atop the map.
Hover over a county or click on it to see its turnout data.
See how each NJ town voted in 2017